Create a financial dashboard with Flask - Part 1
January 31, 2021
python, flask
This is the first post of a three-part series on how to create a financial dashboard with Flask. Flask is a micro-framework to build web applications with Python. This project would be suitable for someone who would like to develop an analysis tool within the Python ecosystem and would like to create a dashboard to showcase their findings. In this series, I will focus on a financial dashboard but the ideas could easily extend to a variety of scenarios.
The series will be split into three parts:
- Create the skeleton of our project 💀
- Pump in the market data and create a chart 📊
- Make our dashboard look cool by making it interactive 😎
Please note, this is not a tutorial series on Flask itself. I am assuming the reader to have some familiarity with Flask. If you have no idea what Flask is or have little experience with Flask, I would suggest having a look at this tutorial series by Hackes and Slackers. This is one of my favourite tutorials about Flask.
Let's dive in!
Project setup #
We will be using poetry to manage our package dependencies. For those who are not familiar with poetry, it is an excellent package designed to make it easier to track and manage the packages we will use in this project. It is somewhat similar to virtual environments, but I find its CLI interface and the way we can identify our dependencies incredibly easy to use. If you want to read more about poetry, you can check out the official documentation.
You can get poetry directly from PyPi with pip.
pip install poetry
Now that poetry is installed, let's configure our project folder structure.
- Create a folder called flask-dashboard
cdinto the folder- In the terminal execute the command:
poetry init
If everything occurred correctly, you should be prompted at the terminal to configure your project. The questions are straightforward, there are just two of them which require attention. When asked if you wish to configure the main dependencies and the dev dependencies, choose no. We will be doing those manually instead.
Once you have answered all the question, you can simply type "yes" and a pyproject.toml file will be created within your folder. If you see this file, you're in the right track. 👍
Configuring poetry #
Poetry automatically creates virtual environments for us, which is great. However, there's one thing I don't quite like about it. It creates them in a default folder, not in your project folder. If you want to inspect the environment or point your IDE to this environment (for example, if you are using VS Code), it is much easier if the environment is located in the same folder as your project.
To see where poetry stores the virtual environments in your machine, you can use the following command.
poetry config --list
You should see an option called virtualenvs.path, that's where the environments are created. I like to change this behaviour, so I changed my configuration to always create the virtual environments where my project is. If you wish to do the same, you can run either of these commands. Note that by default the change is global. If you want to change to be local to your project, you have to tell poetry.
poetry config virtualenvs.in-project true         # global configuration
poetry config virtualenvs.in-project true --local # local configuration
Now that this is out of the way, let's add our package dependencies. In our dashboard, I'd like to add a table and a chart. Tables in python are synonym of pandas, for plotting we will use matplotlib, and of course, we need Flask!. We can add all of these to our project with a single line of code. In the terminal, enter this command
poetry add flask pandas matplotlib
and this will add the three packages to our dependencies. If you open your pyproject.toml file, you will see those there now.
You may also want to add development dependencies to the project. These are the dependencies you need to have in order to write the code but are not required for the application to run. For example, I like to use the flake8 linter, which helps me a lot when writing Python although it is most certainly not required for our project. To install dev dependencies, you just need to append the dev option in the command line.
poetry add --dev flake8
If you have been following along like me, your pyproject.toml file should be looking like this by now. Naturally, your Python and/or package versions may differ.
[tool.poetry]
name = "flask-dashboard"
version = "0.1.0"
description = "Financial dashboard with Flask"
authors = ["Flask Coder <flask.awesome@youremail.com>"]
license = "MIT"

[tool.poetry.dependencies]
python = "^3.9"
Flask = "^1.1.2"
pandas = "^1.2.1"
matplotlib = "^3.3.3"

[tool.poetry.dev-dependencies]
flake8 = "^3.8.4"

[build-system]
requires = ["poetry-core>=1.0.0"]
build-backend = "poetry.core.masonry.api"
Note that you should also have a file called poetry.lock. This is file is used by poetry to install the necessary dependencies. You should commit both your pyproject.toml and poetry.lock files to source control.
To finalise this section about poetry, what happens if your virtual environment is deleted or if you receive a pyproject.toml and a poetry.lock files? How do you install your dependencies? It could not be simpler.
Just run
poetry install
and all of your dependencies will be restored. Yes, I know what you're thinking and you're right, poetry is awesome. There's a lot more what goes into poetry and how you can use it to its best. I would encourage to read the project site if you want to know more.
Now that our packages are ready to be used, let's build our dashboard.
Building the dashboard #
Creating files #
We will use the Flask Application Factory pattern which to me is the best way to modularize our Flask application. You may be thinking: "What the hell is this?". A lot is going on here, but to summarise you can think of that as: "let's use a function to return our application instead of using a global variable everywhere". You can read more about it in Flask's official documentation or in this post.
The main idea is to decouple the implementation of our application from the pages which compose our application. If down the line we have a great idea and would like to add to our dashboard, we should not need to rewrite the whole application. We need to be able to code the new feature in isolation and apply it to our dashboard without breaking any existing functionality. The Application Factory pattern allows us to do exactly that.
Here's how my folder structure looks like.
- app --- our application code
- __init__.py --- init file
- data.py --- handles the dashboard's data
- index.py --- processes the home page, similar to index.html
- util.py --- holds any code which will be commonly use across our app
- static/ --- folder with our app's static files
- styles.css --- css styling
- templates/ --- folder with Flask's templates
- index.html --- home page template
- main.py --- the application entry point
.
├── app
│   ├── __init__.py
│   ├── data.py
│   ├── index.py
│   ├── static
│   │   └── styles.css
│   ├── templates
│   │   └── index.html
│   └── util.py
├── main.py
├── poetry.lock
├── pyproject.toml
Alright, time to start adding some HTML. Let's create our template in the index.html file.
<!DOCTYPE html>
<html lang="en">
  <head>
    <meta charset="UTF-8" />
    <meta name="viewport" content="width=device-width, initial-scale=1.0" />
    <title>Flask Dashboard</title>
    <link rel="stylesheet" href="../static/styles.css" />
  </head>
  <body>
    <h1>Financial Dashboard</h1>
    <br />
  </body>
</html>
As you can see, it is a very simple HTML file. The only thing we are doing is linking to our stylesheet. Let's create that one now.
* {
  margin: 0;
  padding: 0;
  box-sizing: border-box;
}

:root {
  --color-1: #00153d;
  --color-2: #e0ebff;
  --color-3: #182c52;
  --background-color: var(--color-1);
  --text-color: var(--color-2);
}

body {
  background-color: var(--background-color);
}

p,
h1,
h2 {
  color: var(--text-color);
}

table {
  border-collapse: collapse;
}

td {
  color: var(--text-color);
}
Again, nothing special here. We first reset the CSS styles, define some CSS variables with colours and apply those colours to our HTML elements. To make our table look nicer, I am defining the property border-collapse as false.
Next, we will add our Flask routes to our application.
from flask import current_app, render_template
app = current_app

@app.route("/")
def home():
    return render_template("index.html")
This file points our application to the route "/" which should be our default. At the moment, this file is also very simple, we are just rendering the HTML template that we defined previously. However, there is one thing which may not be familiar - what's the deal with this current_app variable? It turns out this is a proxy within Flask's Application Context. This will allow us to refer to our Flask app using our application factory pattern. In the code above, we are simply saying "treat the variable app as the Flask application object".
We also need to build the entry point for our application. We will do this in the __init__.py file.
from flask import Flask

def create_app():

    app = Flask(__name__)
    with app.app_context():

        from . import index
        return app
Ok, this is a bit weird. We are defining a function which will return our app. However, we need to make our app aware of the route we defined in index.py. We do this by importing the file within Flask's application context (note I used relative imports there). This is crucial the current_app we used in index.py only works within the application context. By importing the file, Python executes its code and it will register the route to our app since we used its proxy to define our home page route.
You may be asking, "ok I understand, by why would I do this when I can simply define the route based on my actual Flask app variable as in here?"
app = Flask(__name__)
Yes, you could and this would be fine for small projects. However, as your project grows you may want to add new features and you may want to organize them into different files. Here's where the beauty of the application factory shines. If you want to add a new feature, you just need to follow these steps:
- Create a new file with your super-duper cool functionality
- Make sure to import the Flask's proxy and use it to define the new routes
- In the __init__.py file, just import the file within the application context
This can be a bit hard to sync in the first time. I sure had to give it some time to get my head around it. If you want to read more about it, I would highly recommend the links I mentioned above about the application factory.
Finally, we need to define the entry point of our application. This will go in the main.py file. Since we already split most of the logic into the other files, this one is pretty simple.
from app import create_app

app = create_app()

if __name__ == "__main__":
    app.run(host = "0.0.0.0", debug = True)
Here we import our function, create our application and execute it. Time to see how our dashboard is looking like. ✌️
Running the application #
Because we are using poetry, we can run our application in two ways. In the terminal, you can use either of these commands.
python main.py            # use this if the virtual environment is activated
poetry run python main.py # use this if the virtual environment is not activated
Now you should be able to see our dashboard in localhost:3000 in your browser.
Financial Dashboard
That's probably the most boring dashboard ever created, at least it has some colour 😄. Time to make it interesting.
Adding data #
"Price" table #
The first thing we can do to improve our dashboard is to add some data to it. Let's create a table in our data.py file. If you need to refresh where this file should be, have a look at the folder structure above.
import numpy as np
import pandas as pd
import datetime


def fake_data():

    """
    Generate fake data for testing
    """

    symbols = ["ABC", "DEF", "GHI", "JKL", "MNO"]
    prices = pd.DataFrame(
        np.random.rand(10, len(symbols)) * 100,
        columns = symbols
    )

    today = datetime.date.today()
    prices.index = pd.DatetimeIndex(
        pd.date_range(today, periods = prices.shape[0], freq = "1D")
    )

    return prices
The table above generates some fake data (if not entirely clear from the name of the function 🙄) mimicking price data for financial securities. We will pump in some actual data in the next part of this series. For now, this will do just fine.
By default, tables don't look very nice in HTML. Luckily pandas makes it very easy to add our custom styles to our tables. We need to pass a list of dictionaries. Each dictionary must have:
- selector: this where we target the CSS selectors
- props: the CSS properties we want to alter
For example, the code below adds a bit of styling to our table. Note that I am importing the util.py file with a function called css_variables. We will take care of this in a second. Just add this piece of code to our data.py file.
from .util import css_variables

def format_data_frame(df):

    css = css_variables()

    def hover(hover_color = "#ffff99", text_color = "black"):
        return [
            dict(
                selector = "tr:hover",
                props = [
                    ("background-color", "%s" % hover_color),
                    ("color", text_color)
                ]
            ),
            dict(
                selector = "tr:hover > td",
                props = [
                    ("background-color", "%s" % hover_color),
                    ("color", text_color)
                ]
            ),
            dict(
                selector = "tr:hover > th",
                props = [
                    ("background-color", "%s" % hover_color),
                    ("color", text_color)
                ]
            ),
        ]

    styles = [
        dict(
            selector = "th",
            props = [
                ("padding", "2px 5px"),
                ("text-align", "center"),
                ("border-top", "solid 1px"),
                ("border-bottom", "solid 1px"),
                ("color", "white"),
            ]
        ),
        dict(
            selector = "td",
            props = [
                ("padding", "2px 5px"),
                ("text-align", "center"),
                ("font-size", "0.8rem"),
            ]
        ),
        dict(
            selector = "tr:nth-child(even)",
            props = [
                ("background-color", css['color_3'])
            ]
        ),
        *hover(css["color_2"], css['color_1'])
    ]

    return (
        df
        .style
        .set_table_styles(styles)
        .hide_index()
    )
To use the styles, we call the style property within pandas DataFrame and set the table styles. In this particular case, I am not interested in displaying the index, so I am hiding it in the end but you could leave it if you want to.
Let's create those CSS styles in util.py
CSS styles #
One issue which I faced was that I wanted to reuse the code from my CSS stylesheet but I could just not find an easy way to do it. Then I realised I could define CSS variables and try to come up with a Regex to extract those CSS variables. This would allow me to reuse the colours I defined in my CSS in my Python code without having to copy and paste it. Here's the final version of the Regex. I usually test my regular expressions in regex101.com because I came to realise my first regex is always wrong...
import re
import os
from itertools import chain

loc = os.path.dirname(os.path.abspath(__file__))


def css_variables():

    with open(os.path.join(loc, 'static', 'styles.css'), "r") as f:
        css = f.read()

    var = re.search(r':root\s?\n?{[\w\s\n)(:#;-]*}', css)
    if var is None:
        raise ValueError("Cannot extract css variables")

    var = var.group()
    var = [v.strip() for v in var.split("\n") if v.strip().startswith("--")]
    var = [v.split(";") for v in var]
    var = [v.strip() for v in chain.from_iterable(var) if v.strip().startswith("--")]

    output = dict()
    for v in var:
        key, val = v.split(":")
        key = key[2:].replace("-", "_").strip()
        val = val.strip()
        output[key] = val

    return output
The regular expression extracts all variables within :root and creates a dictionary with their names and properties. I adopted the convention to change dashes into underscores, but you may wish not to do so. With this function, we can simply access our CSS variables in Python easily.
var(--color-1);
  css = css_variables()
  css['color_1']
Creating a chart #
A financial dashboard is not complete without at least one chart. We will use matplotlib to create our chart based on the data from the table we built above. Creating the chart it is not the hardest part, the issue is displaying that chart in the browser. Here's our function that creates the chart. In this example, we are calculating the cumulative return of the price table (with fake data). We accomplish this with the following steps:
- we sort our data by date
- compute the log price
- compute the difference of the log prices, which produces the log-return
- compute the cumulative log-return
- convert log-returns back to relative returns
def plot(prices):

    prices = (
        prices
        .sort_index()
        .apply(np.log)
        .diff()
        .fillna(0.0)
        .cumsum()
        .apply(np.exp)
    )

    return prices.plot()
Cool, now on to the tricky part. Actually, there is no trick at all. It is straightforward as long as you know you can export matplotlib charts to SVGs. I did not know that, but once I discovered this everything became simple. The only thing we need to do is to send an SVG to the browser as our chart. We can do this by storing the chart as bytes and send the decoded SVG text to the browser.
def export_svg(chart):
    output = BytesIO()
    chart.get_figure().savefig(output, format = "svg")
    return output
Now we need to update our index.py file to accept our table and our chart. The complete version looks like this. Note that we need to explicitly tell matplotlib to use the Agg backend here otherwise our export to SVG may not work correctly. I also added a function which it styles our chart in the code below. It just applies our CSS styles to our chart.
import numpy as np
import matplotlib
import matplotlib.pyplot as plt
from flask import current_app, render_template
from .data import fake_data, format_data_frame
from .util import css_variables
from io import BytesIO

app = current_app
matplotlib.use('Agg')


def plot(prices):

    prices = (
        prices
        .sort_index()
        .apply(np.log)
        .diff()
        .fillna(0.0)
        .cumsum()
        .apply(np.exp)
    )

    return prices.plot()


def export_svg(chart):
    output = BytesIO()
    chart.get_figure().savefig(output, format = "svg")
    return output


def customize_chart(chart):
    fig = plt.gcf()
    css = css_variables()

    fig.set_facecolor(css['color_1'])
    chart.set_xlabel(None)
    chart.set_ylabel("Cumulative return", color = css['color_2'])
    chart.tick_params(color = css['color_2'], labelcolor = css['color_2'], which = "both")
    chart.set_facecolor(css['color_1'])
    for s in chart.spines:
        chart.spines[s].set_color(css['color_2'])

    return chart


@app.route("/")
def home():

    df = fake_data()
    _plot = plot(fake_data())
    _plot = customize_chart(_plot)

    try:
        chart = export_svg(_plot)
    finally:
        plt.close() # - close matplotlib window as the chart is already saved in bytes obj

    return render_template(
        "index.html",
        prices = format_data_frame(df).render(),
        chart = chart.getvalue().decode('utf8')
    )
Updating our template #
Once you update the code in index.py, the code will crash unless we update our index.html template. After all, we did not specify any parameters there. It does not know how to handle the price and chart parameters. Let's fix that.
<!DOCTYPE html>
<html lang="en">
  <head>
    <meta charset="UTF-8" />
    <meta name="viewport" content="width=device-width, initial-scale=1.0" />
    <title>Flask Dashboard</title>
    <link rel="stylesheet" href="../static/styles.css" />
  </head>
  <body>
    <h1>Financial Dashboard</h1>
    <br />
    {{prices}}
    <br />
    <h1>Chart</h1>
    {{chart}}
  </body>
</html>
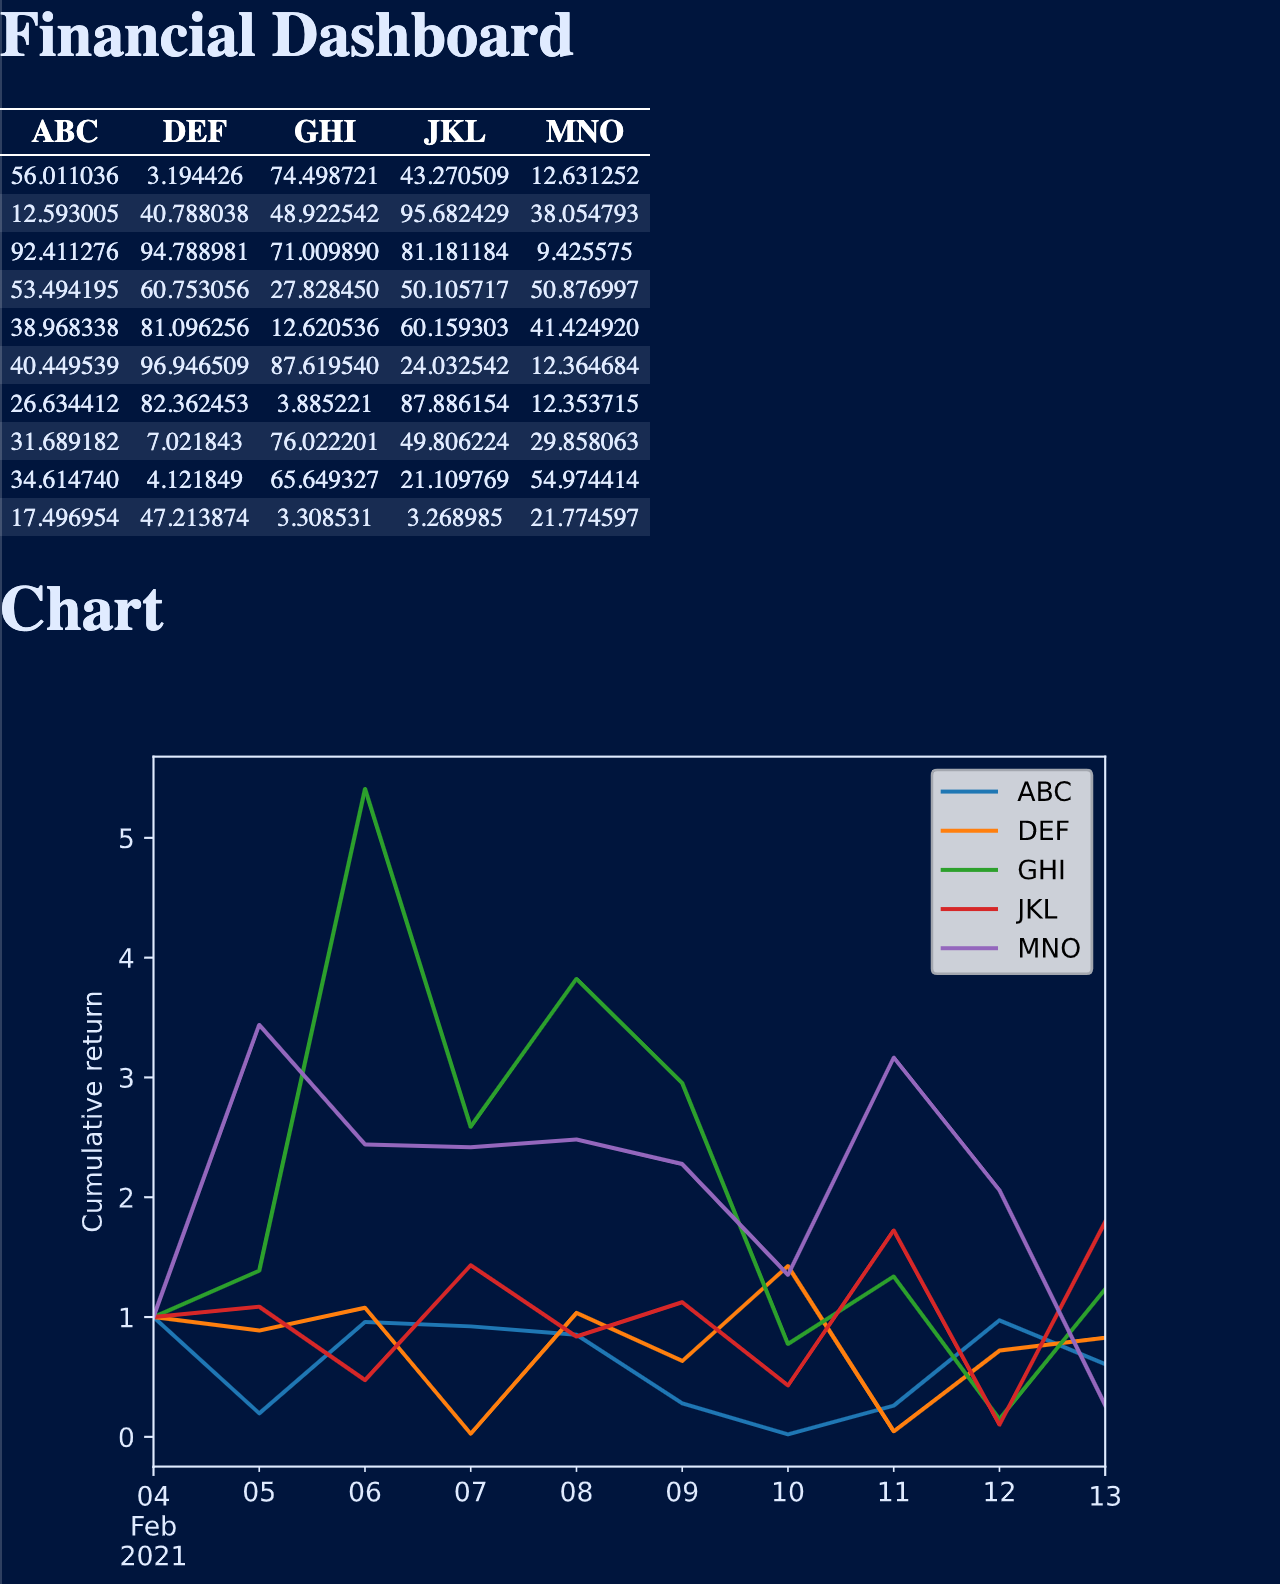
Now we if reload our application, we should be able to see our table and chart. Note that you may need to rerun your Flask app in case it crashed because the template had not been updated. This is how our dashboard looks right now.
Financial Dashboard
<style type="text/css" > #T_560c4_ th { padding: 2px 5px; text-align: center; border-top: solid 1px; border-bottom: solid 1px; color: white; }
... and a lot more of HTML ...
Flask did not display the table nor the chart!
Instead, it displayed the raw HTML. By default Jinja, which powers Flask's templates, escapes the HTML. Adding raw HTML to our app opens the application to security vulnerabilities, and that's why Jinja escapes HTML by default. It puts safety first, which is not a bad default if you ask me. In order to use the HTML pandas and matplotlib generate, we must tell Jinja it is ok not to escape that code. In this particular case, we know it is ok since we are generating the HTML. If you are building an application that accepts any HTML and you cannot guarantee it is safe, you should strongly consider escaping that HTML.
To do this, we pass the safe flag to our variables. After the template is updated, you should be prompted with the dashboard, now working correctly.
<!DOCTYPE html>
<html lang="en">
  <head>
    <meta charset="UTF-8" />
    <meta name="viewport" content="width=device-width, initial-scale=1.0" />
    <title>Flask Dashboard</title>
    <link rel="stylesheet" href="../static/styles.css" />
  </head>
  <body>
    <h1>Financial Dashboard</h1>
    <br />
    {{prices | safe}}
    <br />
    <h1>Chart</h1>
    {{chart | safe}}
  </body>
</html>
The Dashboard #
If you made it this far, congratulations. We now have our own dashboard built with Flask, pandas and matplotlib. The dashboard looks alright, but at the moment is not very useful since we only used fake data. In the next part of this series, we will source actual market data and pipe it to our dashboard. If you followed along like me, your dashboard should be looking like this. Note that the data is currently random, so your numbers and chart will look a bit different.
There was a lot to cover in this part. If you felt a bit lost or if something did not work as you expected, you can check out this repository where you can see the finished project. If you want to see how part 1 of the series finished (this post) without getting overwhelmed with the next parts for this series, you can check out the branch part1 in the repo. It contains code only up until the end of this post.
Until next time. 🚀